
Reports & insights
Statistics
In short
This guide explains Statistics in the Reports & insights area of ClinicSoftware. It provides a clear operational explanation of how the capability works, then outlines the practical benefits for saving staff time, converting clients and leads, and protecting clinic revenue.
On this page
Overview
This guide explains Statistics in the Reports & insights area of ClinicSoftware. It provides a clear operational explanation of how the capability works, then outlines the practical benefits for saving staff time, converting clients and leads, and protecting clinic revenue.
How it works
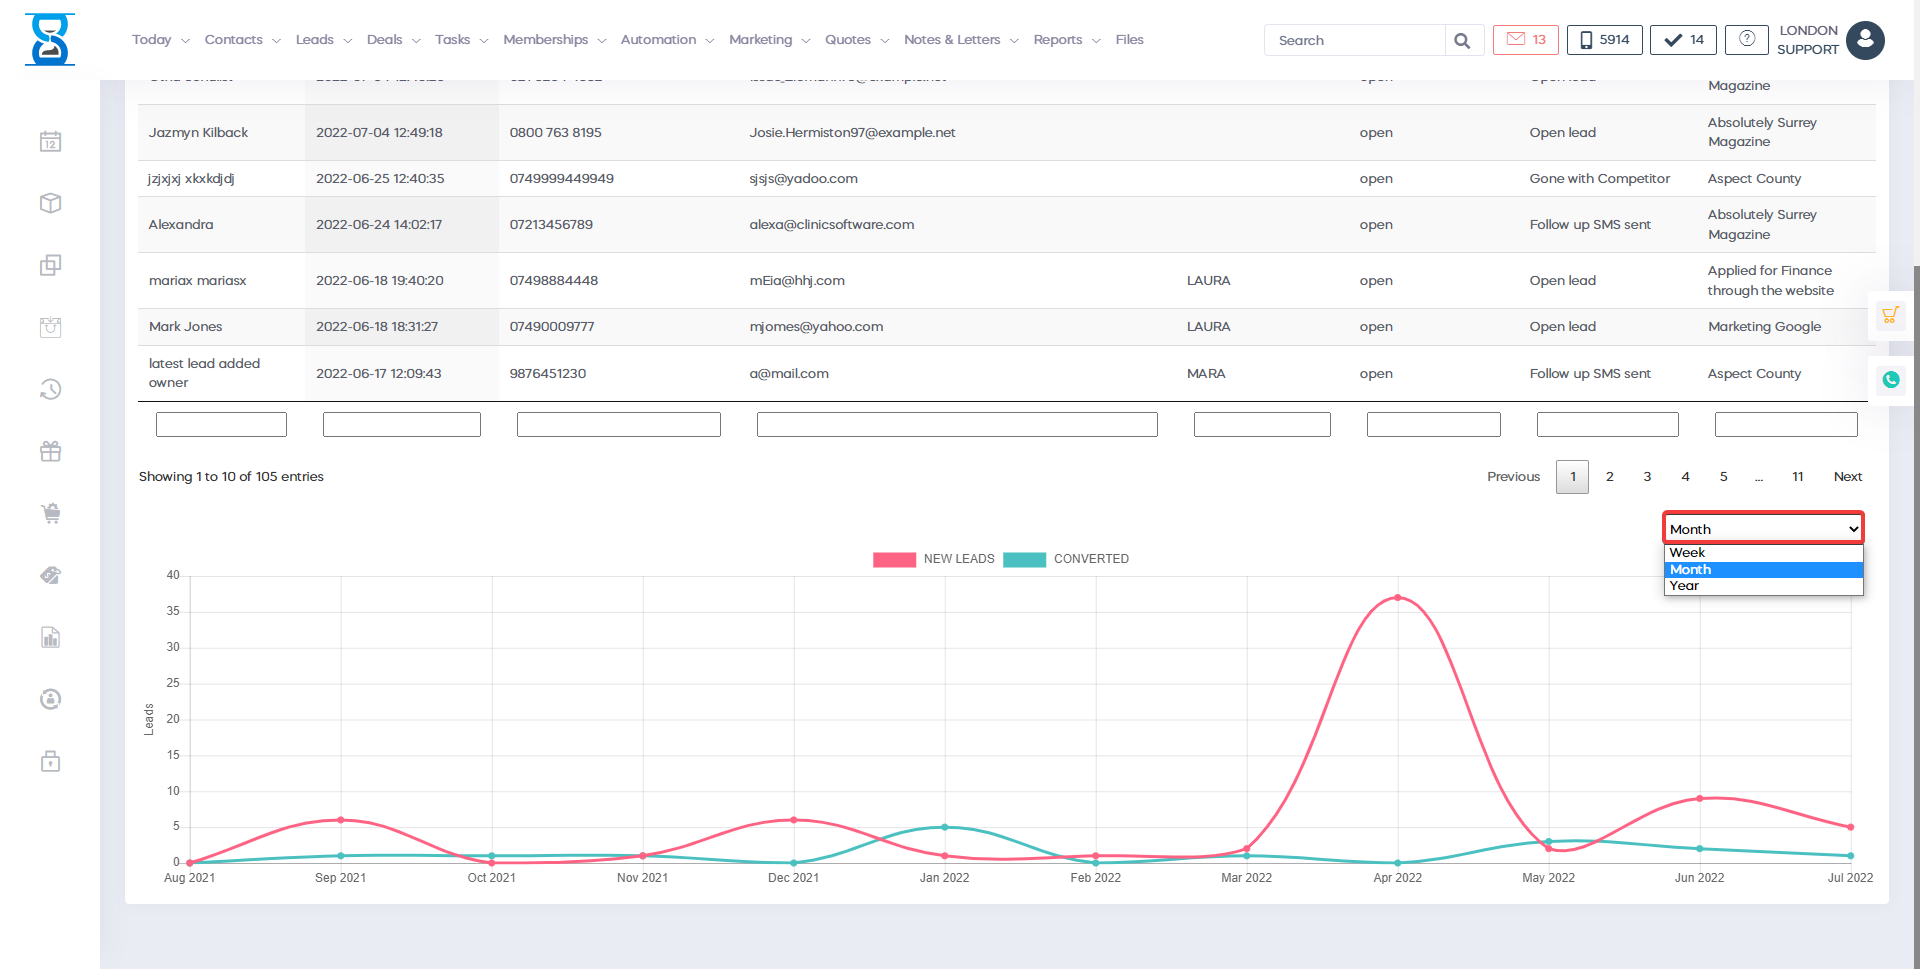
Below the lead table we display a chart indication total number of leads vs converted.
This chart can be shown by Week, Month (default) and Year, to change the source, use the dropdown from the top-right section of the chart.
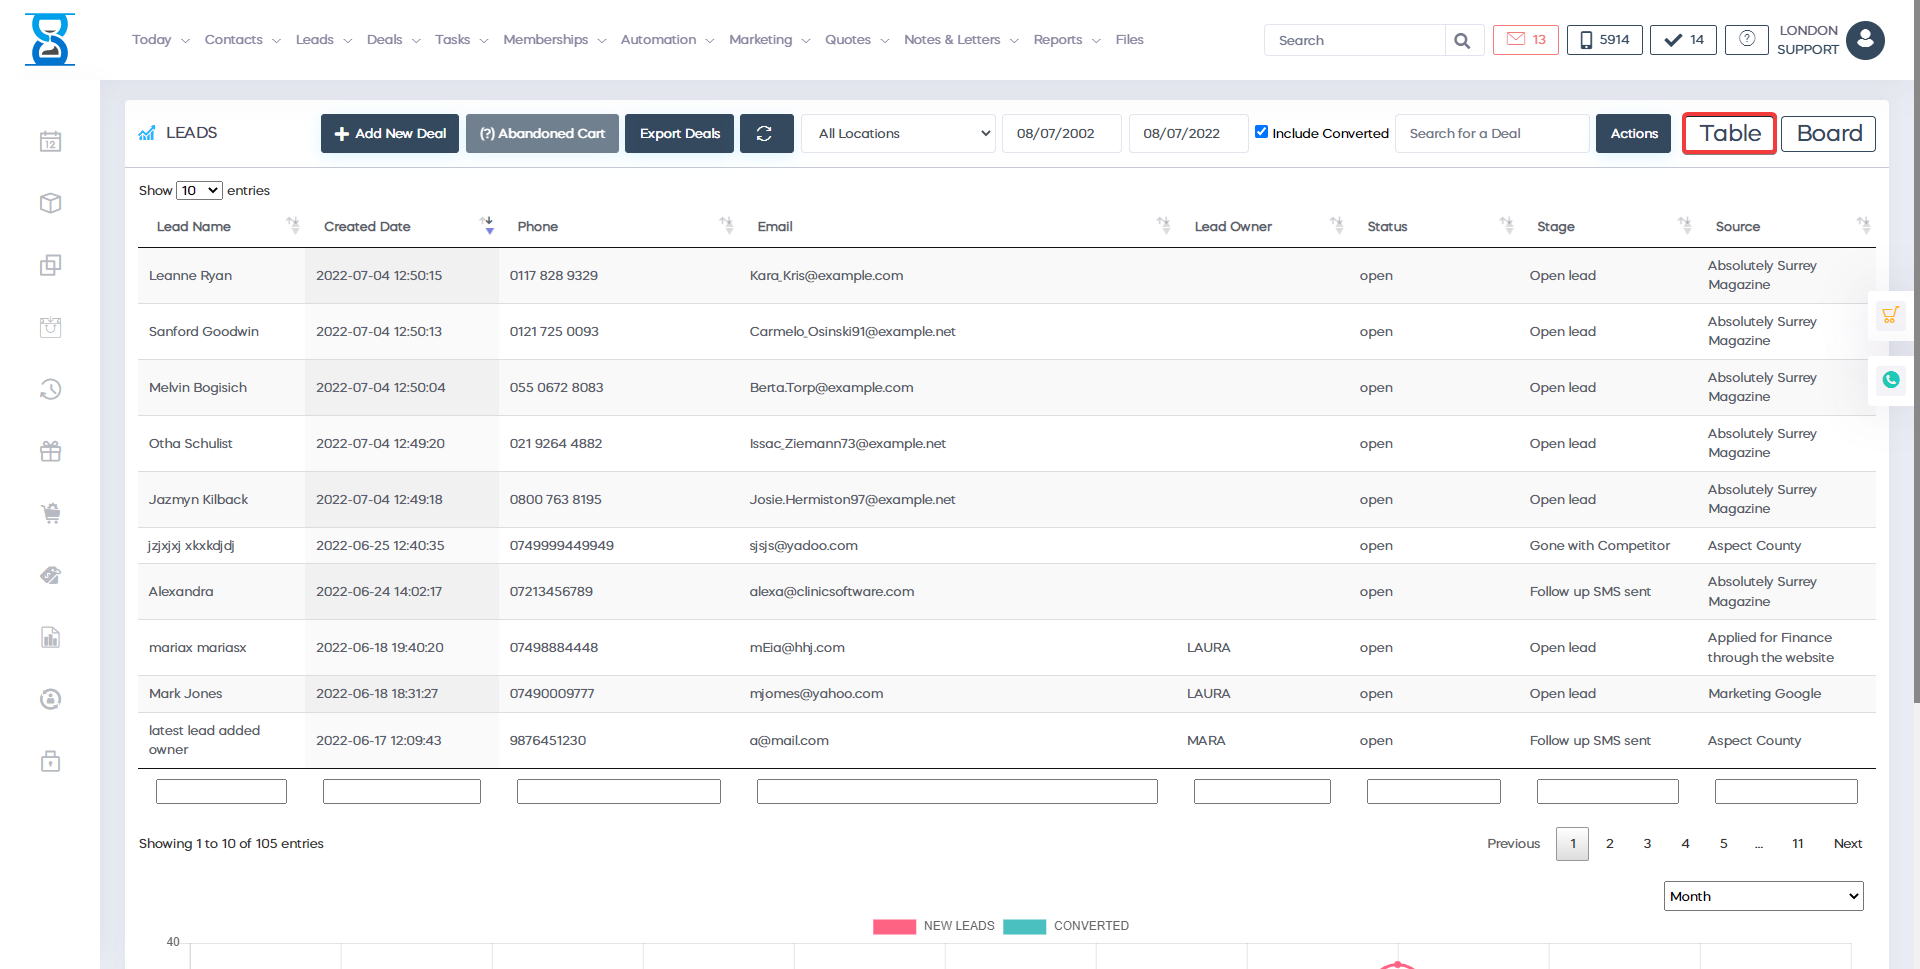
If you hover the mouse cursor on the chart the system will display the actual numbers of the Week/Month/Year.
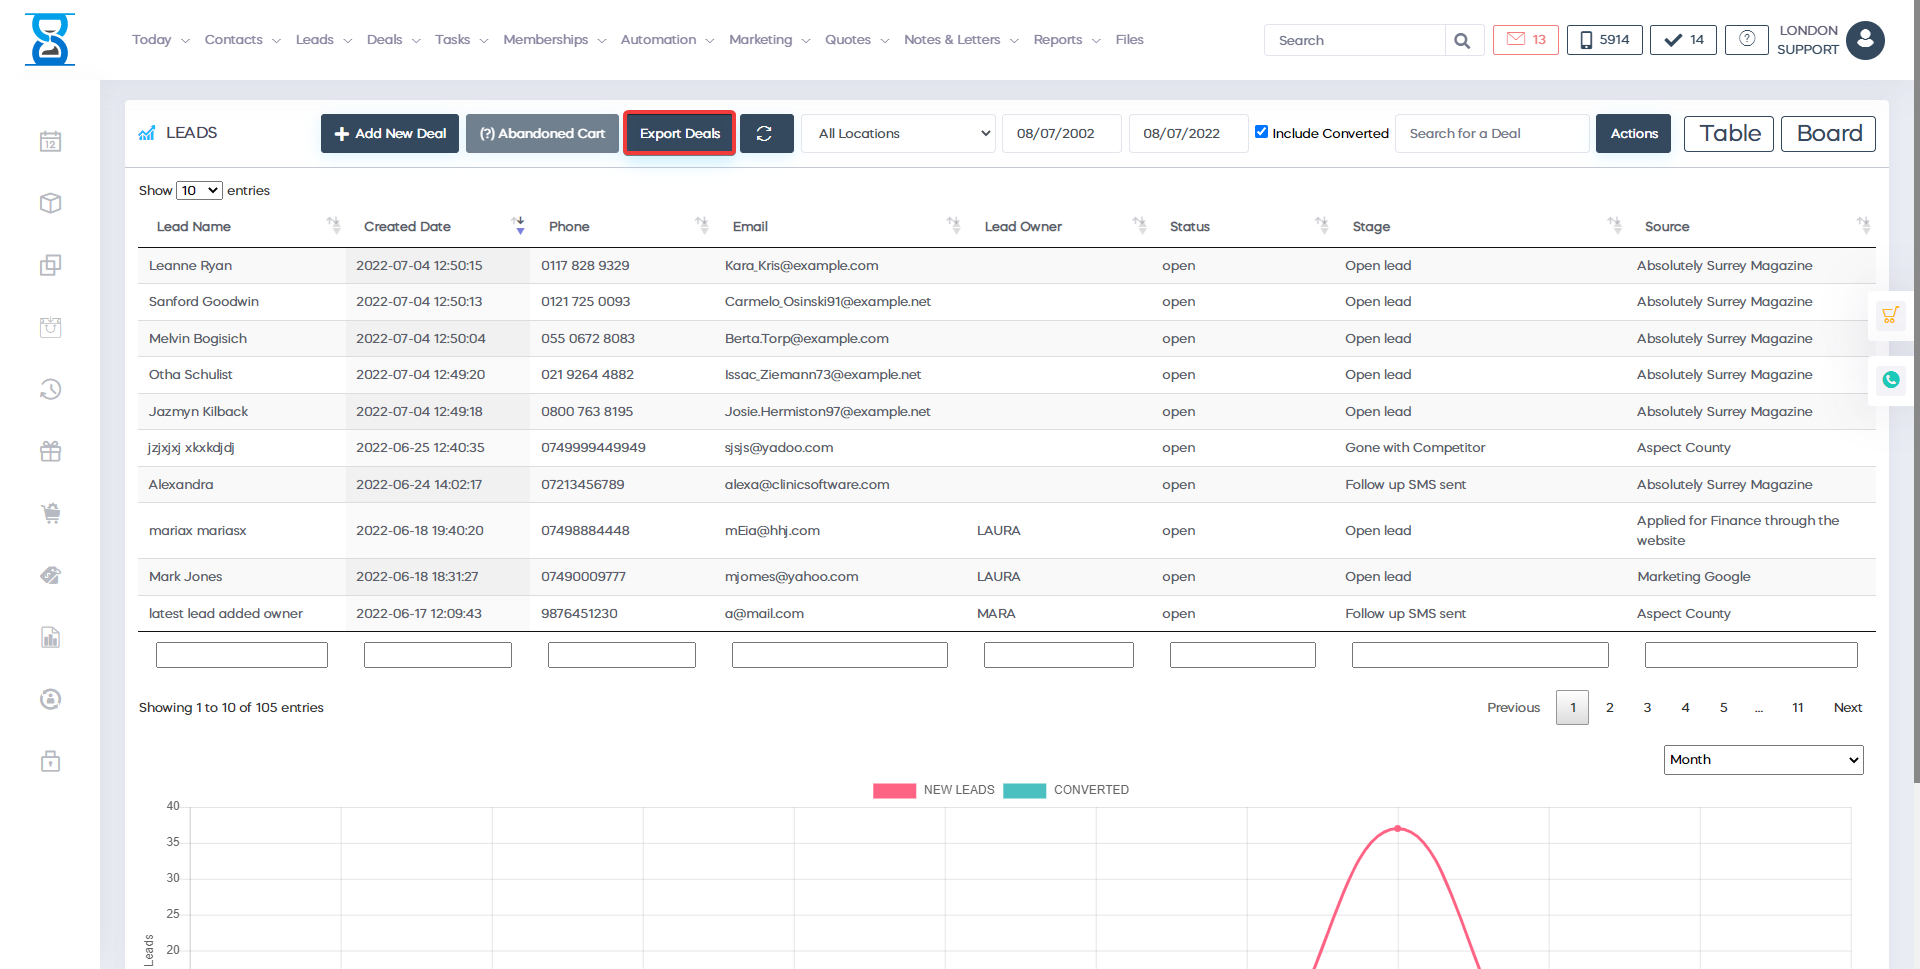
You can also select the chart header to enable or disable the NEW LEADS and CONVERTED lines.
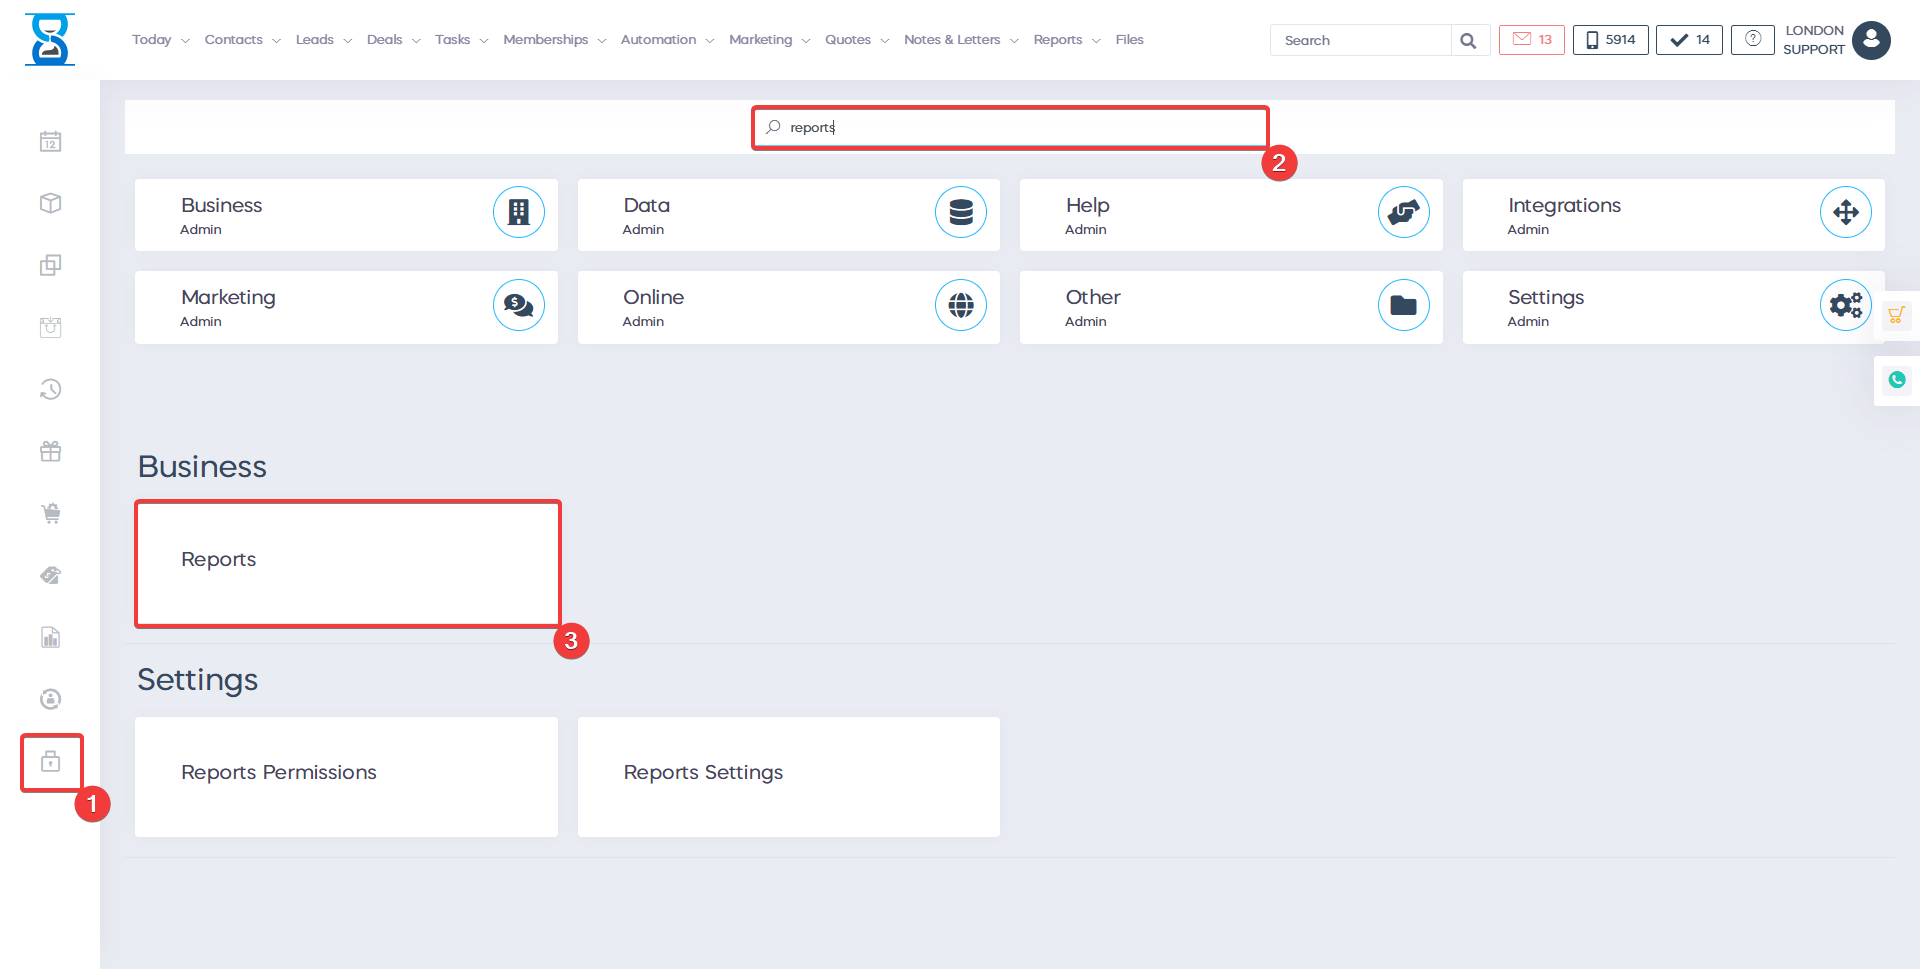
Benefits for your clinic
- Save time: Provides ready-made insight for Statistics, removing the need to assemble performance numbers manually.
- Win clients and leads: Highlights where enquiries stall so managers can improve conversion processes.
- Generate revenue: Clear commercial visibility helps the clinic act quickly on underperforming services, staff capacity or sales opportunities.