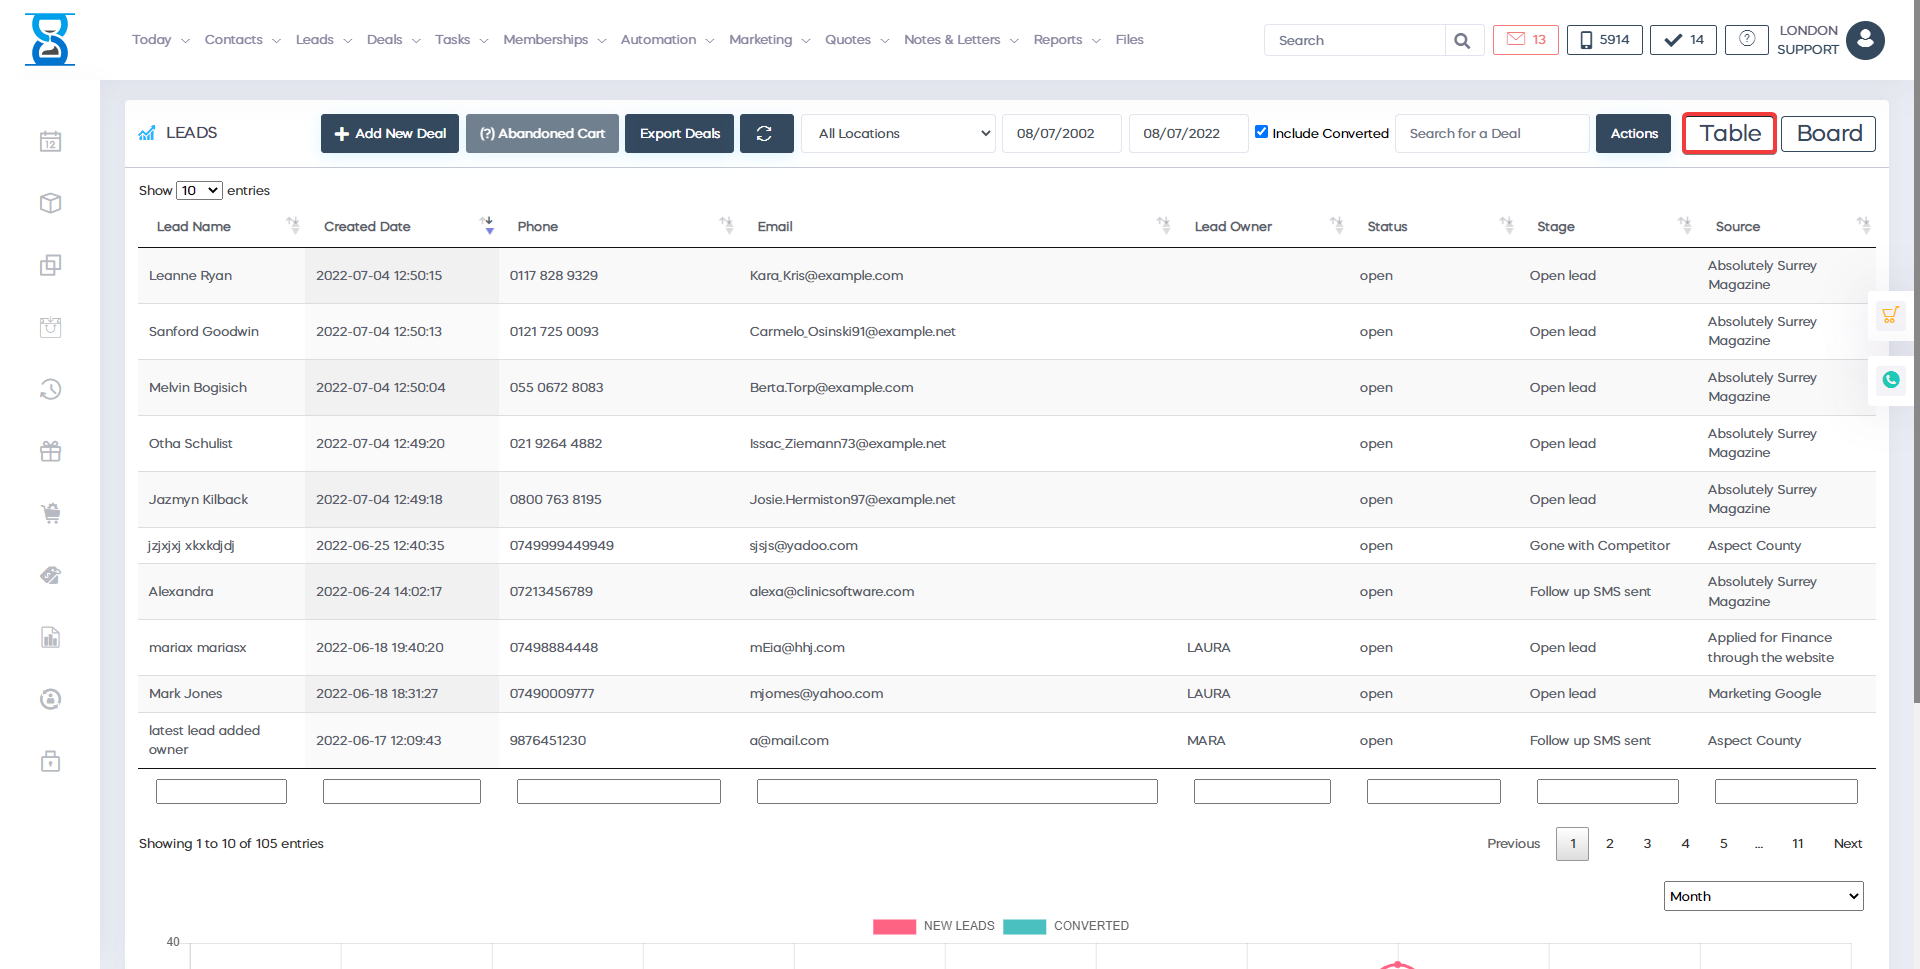
Below the lead table we display a chart indication total number of leads vs converted.
This chart can be shown by Week, Month (default) and Year, to change the source, use the dropdown from the top-right section of the chart.
If you hover the mouse cursor on the chart the system will display the actual numbers of the Week/Month/Year.
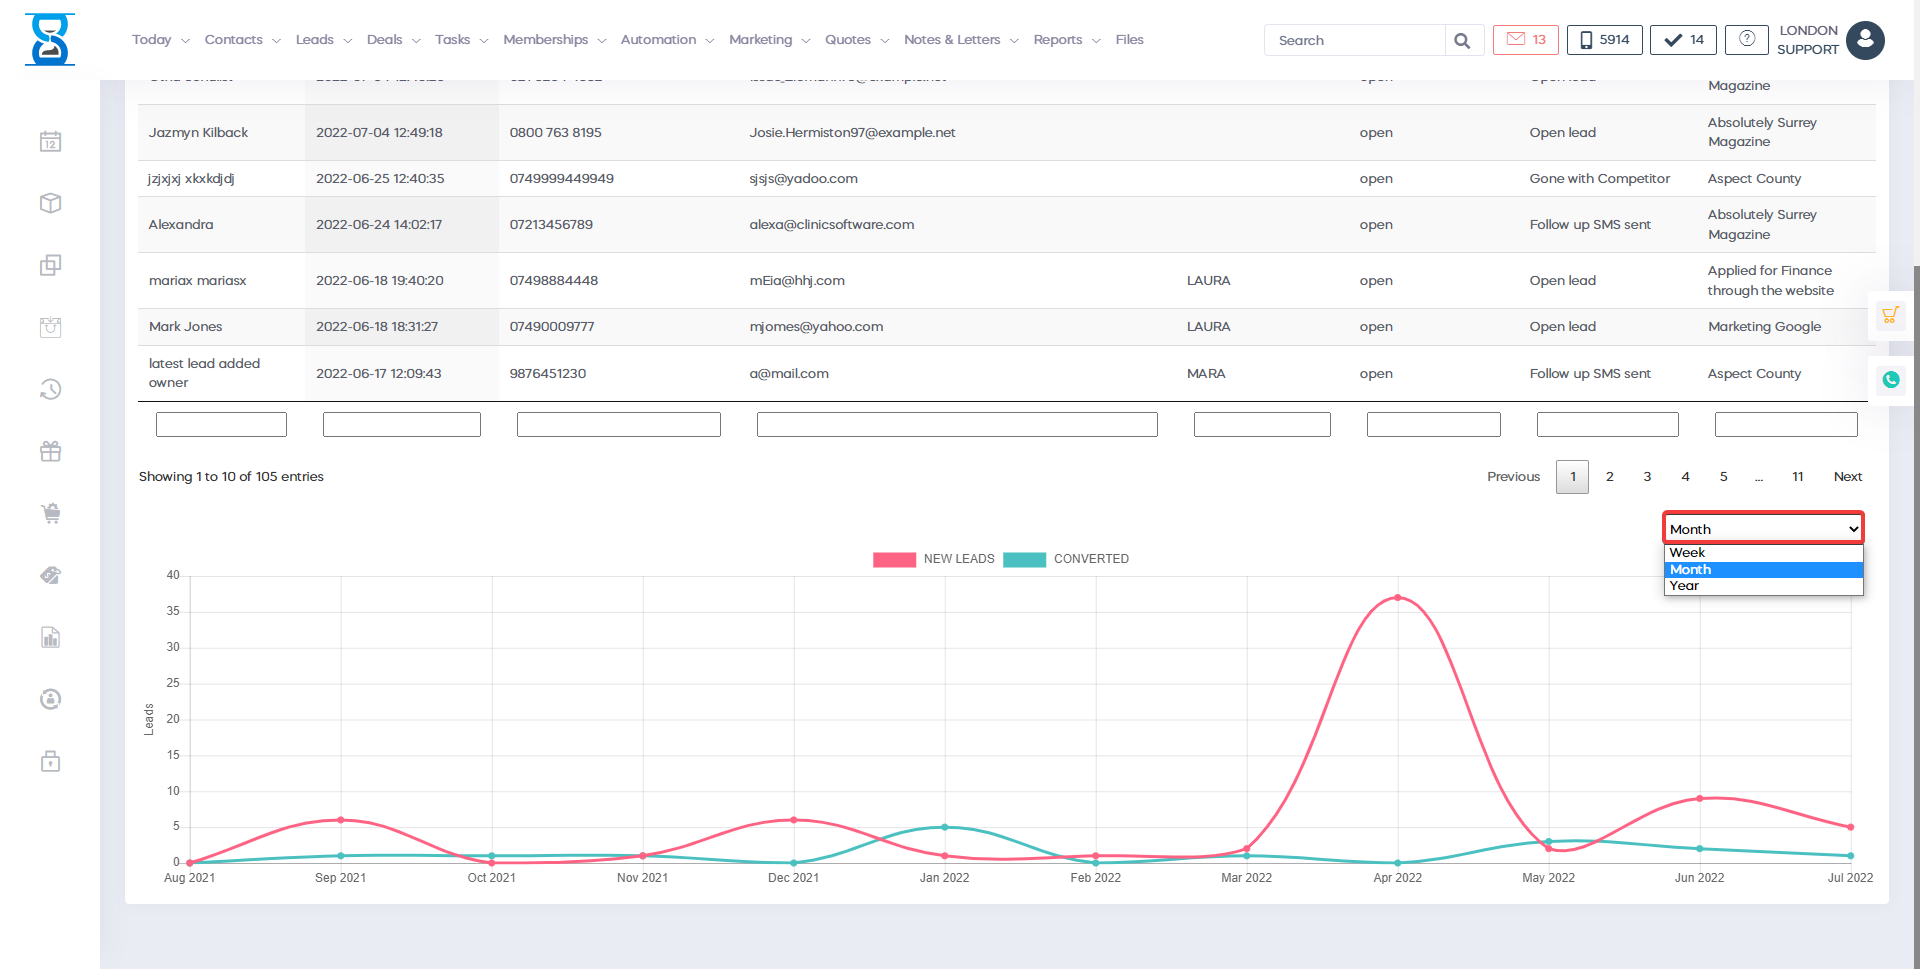
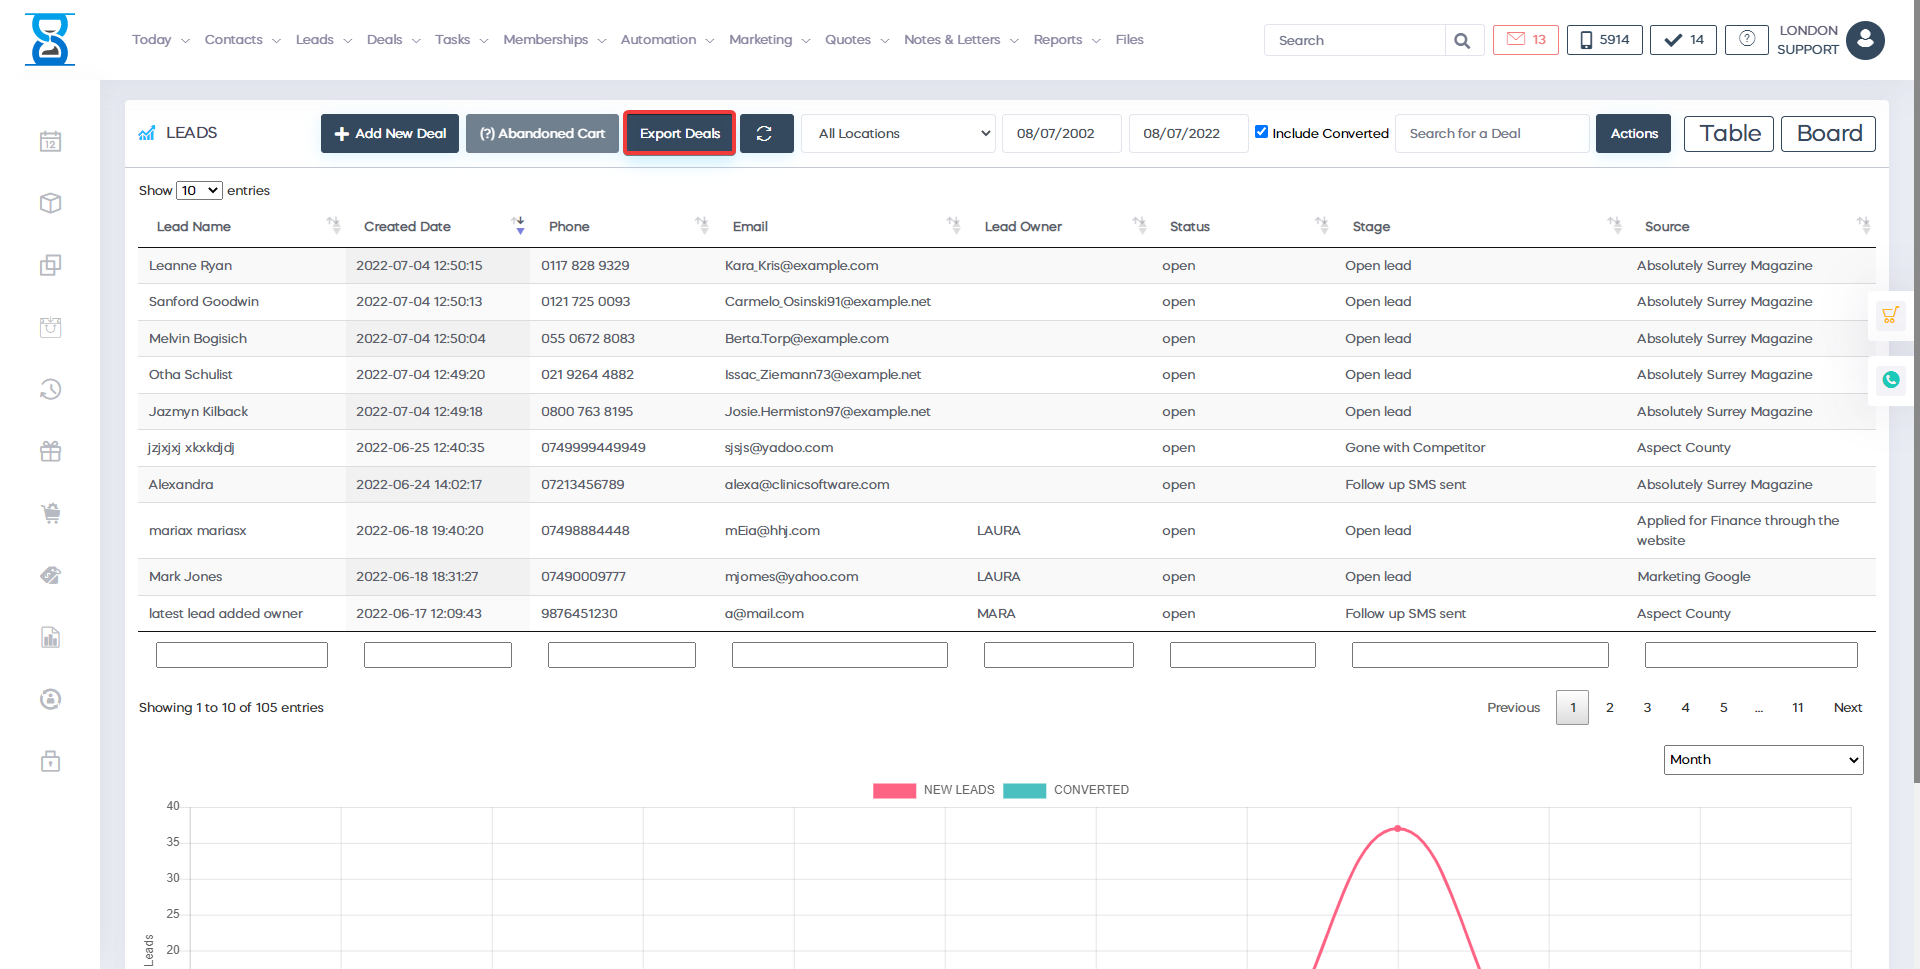
You can also click on the chart header to enable or disable the NEW LEADS and CONVERTED lines.